“We encourage organizations and community leaders who seek to improve health outcomes in our community to review the data and use it to help them make informed decisions about program goals and activities,” said Montgomery County Health Commissioner Jennifer Wentzel.
The data in the assessment will also be used to formulate the county’s 2023 Community Health Improvement Plan, which will help guide health-related activities. It comes from multiple sources including surveys and surveillance systems.
Using multiple data sources allows for a comprehensive picture of the community, officials said.
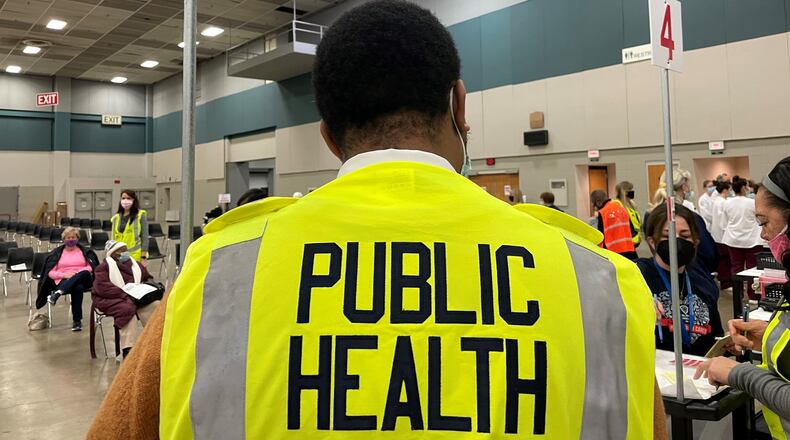
“It’s more accessible,” said Public Health spokesman Dan Suffoletto about the new format online. “It’s easier to share.”
The main categories on the assessment include information about Montgomery County demographics, along with behavioral health, physical health and the social determinants of health.
“Different parts of it are going to be valuable to different people in different ways,” Suffoletto said. The data can aid community partners, stakeholders, and residents in identifying priority health issues, developing goals, and selecting strategies to improve residents’ health.
The assessment is produced and managed by Public Health’s epidemiology program, data highlights may be found in the executive summary.
The full Community Health Assessment may be viewed at www.cha.phdmc.org.
BY THE NUMBERS
Montgomery County exceeds state and national averages in some health indicators, according to the new Community Health Assessment. Some of those areas include:
- Low birth weight, 9.1% in Montgomery County versus 8.5% in Ohio and 8.2% in the U.S.
- Pre-term birth, 11.1% in Montgomery County versus 10.3% in Ohio and 10.1% in the U.S.
- Infant mortality, 8.4 deaths per 100,000 births in Montgomery County in 2020 versus 6.7 in Ohio and 5.4 in the U.S.
- Cancer death rate per 100,000 deaths in 2018 and 2019: 175.0 in Montgomery County, 165.2 in Ohio, and 146.2 in the U.S.
- Lung death rate per 100,000 deaths in 2018 and 2019: 45.6 in Montgomery County, 42.9 in Ohio, and 33.4 in the U.S.
- Chronic lower respiratory disease (2017-2020): 13.4% in Montgomery County, 8.0% in Ohio, and 6.2% in the U.S.
- Current smoker (2018-2020): 21.0% in Montgomery County, 19.3% in Ohio, and 15.5% in the U.S.
- Flu shot in the last 12 months (2018-2020): 47.6% in Montgomery County, 64.8% in Ohio, and 67.8% in the U.S.
- No physical activity in the last 30 Days (2018-2020): 26.0% in Montgomery County, 24.5% in Ohio, and 22.7% in the U.S.
HIV and sexually transmitted infections and diseases can be spread through sexual activity and may or may not cause symptoms. Chlamydia is the most reported sexually transmitted disease, but it has decreased since 2016. The number of gonorrhea cases has been increasing since 2016. Although Black people have more reported new diagnosis of HIV infection, white people have four times the rate of living with a diagnosed HIV infection.
The gonorrhea rate per 100,000 individuals in 2019 and 2020 was 415.5 in Montgomery County, compared to 265 in Ohio and 206.5 in the U.S. New HIV infections rate per 100,000 in 2019 and 2020 was 6.6 in Montgomery County, 7.7 in Ohio, and 12.6 in the U.S.
About the Author

