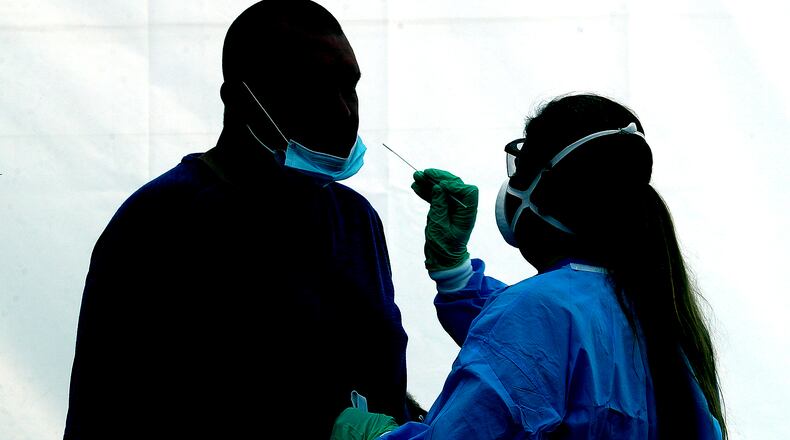
“We’re confident this information will help better inform decisions in communities,” ODH Chief Medical Officer Bruce Vanderhoff said.
If a county administers fewer than 20 tests a week, they will be a lighter color than the other counties. Vanderhoff noted that if a small number of tests are administered, data can be skewed.
The positivity data is measured using testing information from the previous two weeks.
“At the county level, we’ll be displaying PCR test results to be consistent with the standard national reporting,” Vanderhoff said. “We will continue to report PCR and antigen test results on a state level as we have been doing since October.”
There may be a slight increase in the PCR test results on the state level as a result, he added.
The test positivity data will help paint a more accurate picture of the state’s fight against COIVD and help determine a community’s risk level.
Vanderhoff noted, however, that test positivity is only one part of the picture and that other factors, such as cases per 100,000 people, increase in cases, hospitalizations, ICU capacity, need to be looked at as well.
Also starting next week people will be able to download weekly county data, including testing per capita.
With more local data available, this could impact how different communities respond to the pandemic.
“I’m sure as we live with this data more we’ll have an ongoing dialogue with local health departments or others as how we can best save lives,’ Vanderhoff said.
The state used a new data system to develop the dashboard where labs report information directly and electronically. Previously Ohio received aggregate data that was manually reported by labs.
“This has been a very extensive process,” Vanerhoff said. “We’ve been working very closely with laboratories across the state to validate the positivity data and build this map.”
About the Author
