Ohio Issue 1: Here’s how local counties voted

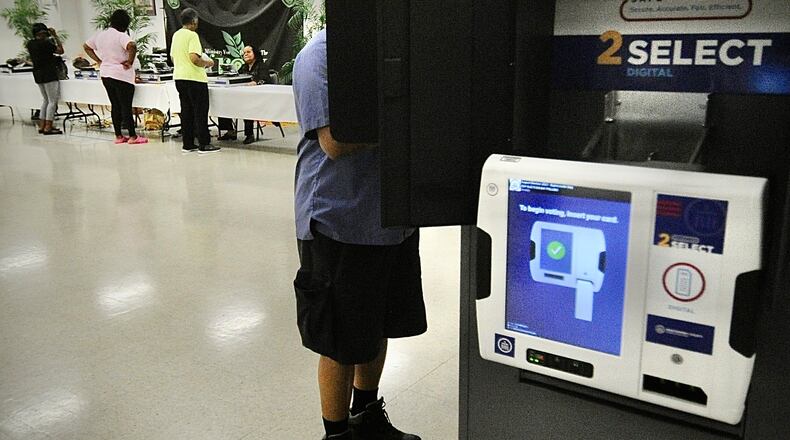
There was strong Voter turnout for an August election at the St. Luke Missionary Baptist Chruch, on Gettysburg Ave.  Tuesday Aug. 8, 2023. MARSHALL GORBY\STAFF

There was strong Voter turnout for an August election at the St. Luke Missionary Baptist Chruch, on Gettysburg Ave. Tuesday Aug. 8, 2023. MARSHALL GORBY\STAFF

Ohio voters rejected Issue 1 by a 57-43 ratio. The measure would have made it much harder for Ohio citizens to change their Constitution. The vote count varied dramatically, with smaller rural counties having the highest “yes” totals.

Below are the Election Night totals from local counties:


Ohio Issue 1 voting results

LocationYesNoTurnout
Statewide43.0%57.0%38.5%
Montgomery County39.1%60.9%37.1%
Greene County49.5%50.5%42.8%
Clark County*50.0%50.0%37.1%
Butler County50.3%49.7%35.3%
Warren County52.8%47.2%41.9%
Miami County61.8%38.2%41.6%
Champaign County62.3%37.7%39.1%
Preble County67.7%32.3%38.5%
Darke County75.1%24.9%44.3%
Source: Ohio Secretary of State and county boards of election. * Clark County had 16,014 yes votes and 16,015 no votes.

About the Author